
Aliasing When Creating EPS Files in Matlab
I have been working in LaTeX for a paper I’m writing, and have found that if you want to include Matlab graphs in a LaTeX document, EPS files are by far the best way to go. EPS files are converted to PDF graphics and then included in the resulting PDF, which looks way better than plugging a JPEG or a PNG file in directly.
However, I came across a weird issue when trying to save one of my graphs. I used the confusionmat function in Matlab to create a confusion matrix from a set of ground truth and observation data pairs. I then wrote a simple script to create a nice graphical representation of the confusion matrix (adapted from here).
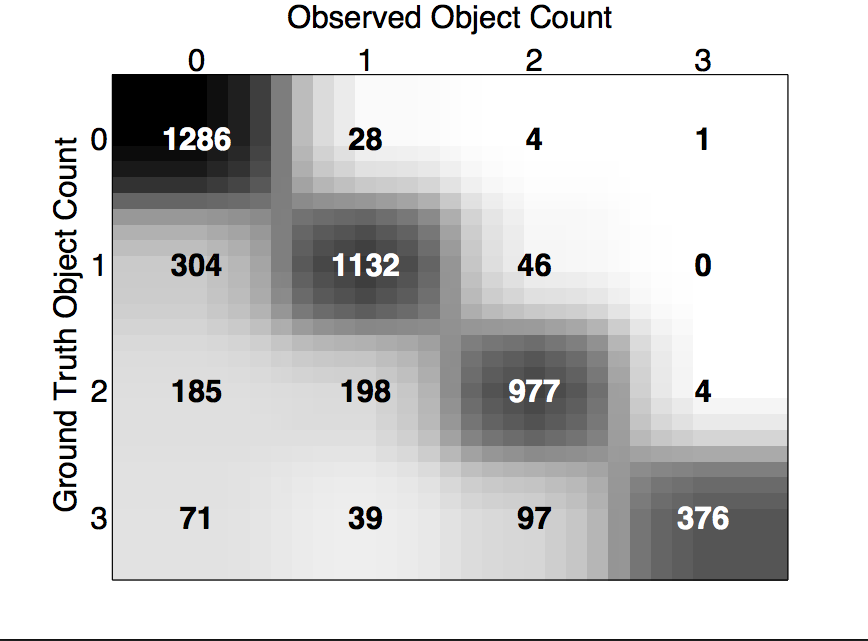
The only problem was that when I tried to export as a EPS file, I got the following weird aliasing effect.
I looked at a bunch of different options for fixing the issue: different LaTeX compiler settings, applying filters in Matlab, using GhostView as the viewer for the EPS file. None of it seemed to help. I think at the end of the day, it didn’t have to do with the EPS file itself, but the software/driver my Mac was using to view the EPS file and subsequently convert it to a PDF graphic.
The solution that ended up working for me? A surprisingly easy one. I finally found that if I scaled the matrix itself up by a large factor before graphing into a Matlab figure, the aliasing effect was eliminated. I had to change some of the logic that printed confusion matrix numbers themselves at the right position, but it was a surprisingly simple fix to a strange problem. Full script below.
function [pcts] = confusion_plot(cmat, order)

SCALE = 100;

% turn into percentages
totals = sum(cmat, 2);
pcts = zeros(size(cmat));
for i = 1:size(cmat, 1)
    for j = 1:size(cmat, 2)
        point = cmat(i,j);
        total = totals(i);
        pcts(i,j) = point / total;
    end
end

% flip so that the darks are high percents
pcts_flipped = 1 - pcts;

pcts_scaled = scale_matrix(pcts_flipped, SCALE);

imagesc(pcts_scaled);
colormap(gray);

set(gca,'FontSize',20);
set(gca,'XTick',SCALE/2+1/2:SCALE:SCALE*length(order)-SCALE/2);
set(gca,'YTick',SCALE/2+1/2:SCALE:SCALE*length(order)-SCALE/2);
set(gca,'XTickLabel',order);
set(gca,'YTickLabel',order);
set(gca, 'Ticklength', [0 0])
set(gca,'XAxisLocation','top');
ylabel('Ground Truth Object Count');
xlabel('Observed Object Count');

% show the text percentage values
for i = 1:size(pcts, 1)
    for j = 1:size(pcts, 2)

        pct = pcts(i,j);

        color = [0 0 0];
        if pct > 0.6
            color = [1 1 1];
        end

        text(j*SCALE-SCALE/2+1/2,i*SCALE-SCALE/2+1/2,num2str(cmat(i,j), 4), ...
            'FontSize', 20, ...
            'FontWeight', 'bold', ...
            'HorizontalAlignment', 'center', ...
            'Color', color);
    end
end

end

function [scaled] = scale_matrix(mat, scale)

scaled = zeros(scale * size(mat));

for i = 1:size(scaled, 1)
    for j = 1:size(scaled, 2)
        i_prime = ceil(i / scale);
        j_prime = ceil(j / scale);
        scaled(i, j) = mat(i_prime, j_prime);
    end
end

end
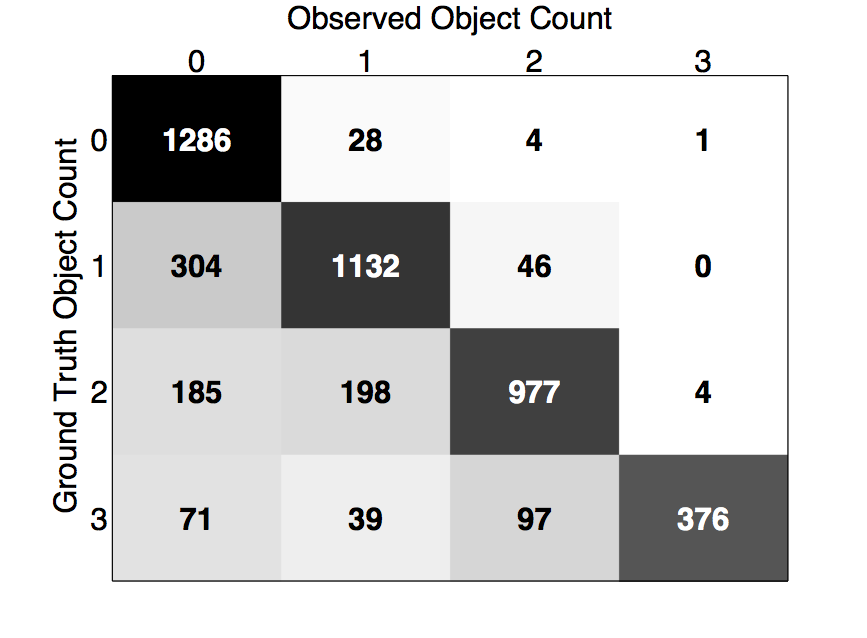
Here’s the resulting EPS file, with the aliasing pretty much eliminated.
I’m sure its not the most elegant way to solve the issue, but if you’re looking for a simple way to minimize the odd aliasing effect caused by exporting Matlab figures to EPS files, give this approach a shot.